


.png)

Let’s say you’ve created the perfect packaging design for your new product. It’s on-trend, appears to highlight your product’s best features, and your CEO actually likes it.
But do you know if your consumers will see it that way?
When they see your product for the first time, will your brand, unique claims, and features draw them in?
Will it stand out on the shelf against your category competitors?
These are big questions for any marketing, product, or creative team, and they apply to every design element for a product. That includes your website, your ads, and even where your product shows up in the store.
Since good (read effective) design is subjective, it’s critical to determine how it performs among the most important people: your consumers. After all, it’s hard to communicate differentiating features and brand fit if neither is breaking through on the pack or on the shelf.
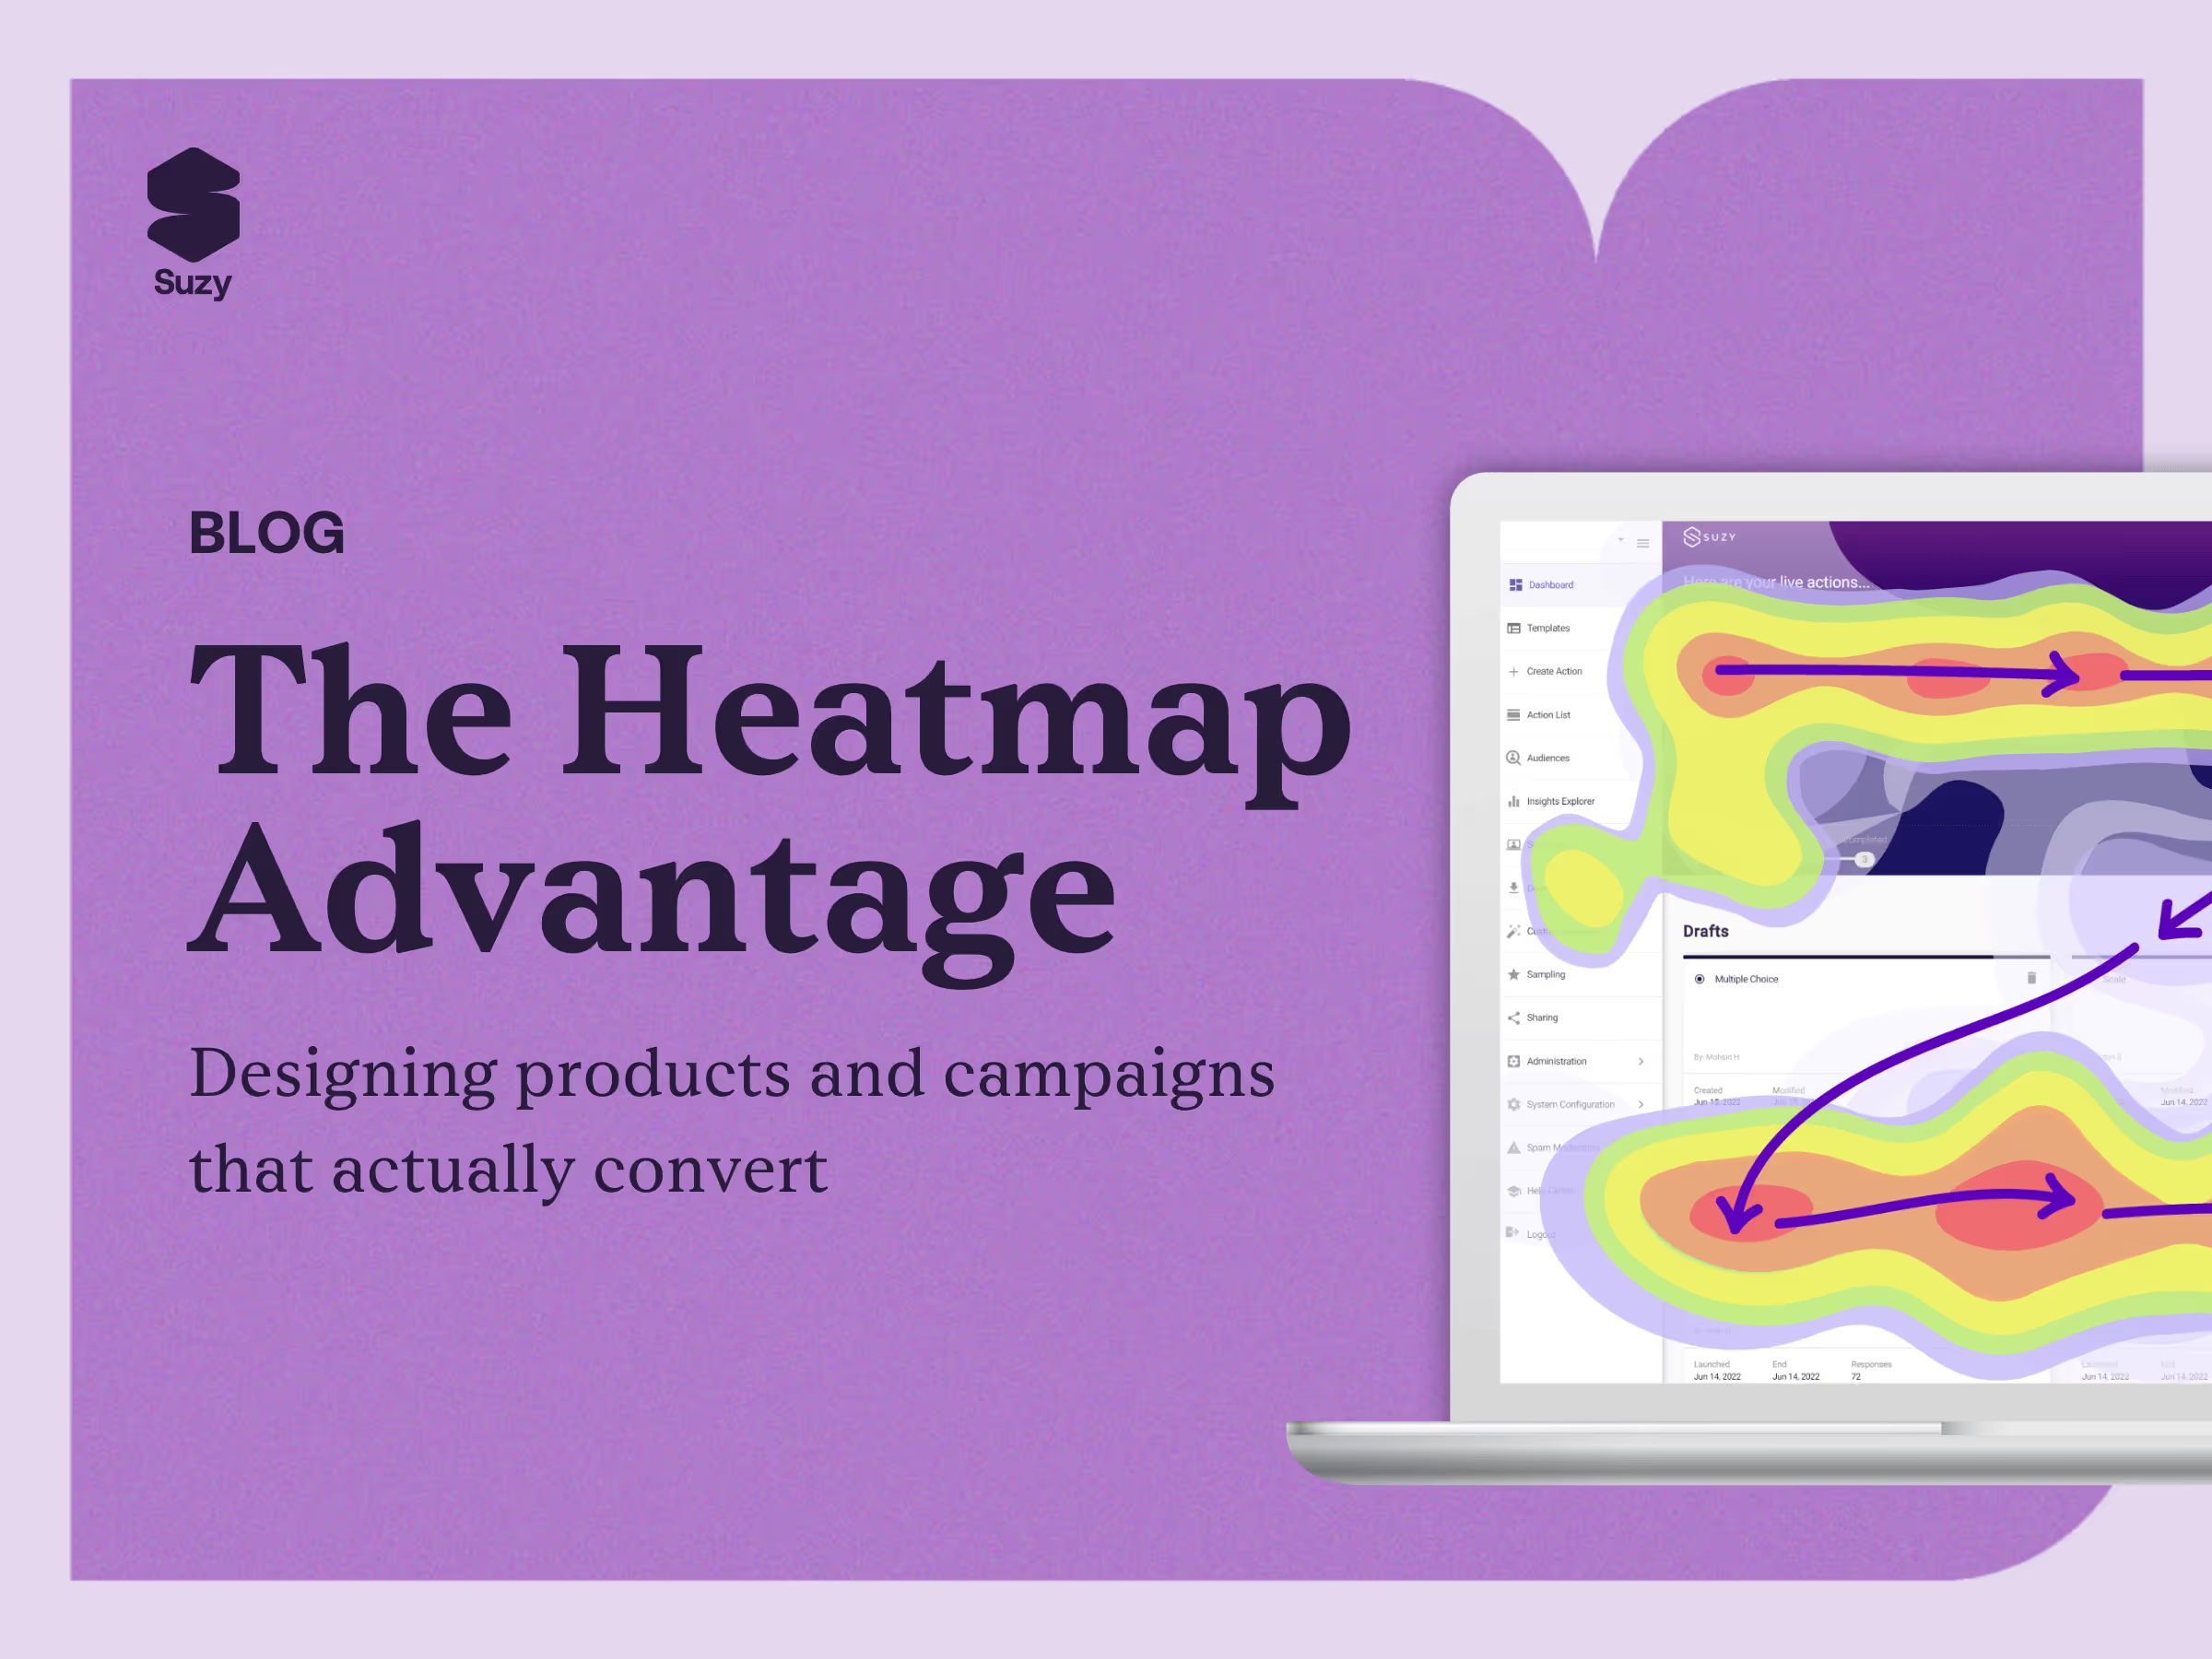
That’s where heatmaps come in.

What is a heatmap?
A heatmap is a predictive, visual analytics tool. Brands, creatives, and marketing teams use them to understand how consumers see visual content. A heatmap measures the following three factors:
- How eye-catching an image is
- The level of attention each element receives
- The order in which each element is viewed
All the factors add up to figuring out how your consumer sees something in the first few seconds before their human bias kicks in.A heatmap uses a red-blue color gradient to measure saliency. Saliency is the measurement of how noticeable or important a certain element is. On your typical heatmap, warmer colors (reds, oranges, yellows) show a high concentration of saliency. Cooler colors (turquoise and blue), show low saliency, and green shows an average between high and low. These colors show where consumers look in the first few seconds when they see a design and where they don’t.Heatmapping studies work best with quantitative and qualitative research. Retail market research can help you dig deeper into the subjectivity of your design, or what it actually “says” to consumers.

Eye tracking and heatmapping
Eye-tracking software powers heatmapping by measuring the movement of the eye. Using the data from over one million eye tracking studies, the software relies on complex algorithms. These algorithms can determine where a person looks or where their gaze goes. With this information, you can better determine what will draw your consumer in.
Brands have the option of running live eye-tracking studies, which can also be useful to determine attention and gaze pathing. But live studies can be costly and time-consuming. They require participant recruitment, special equipment, and dedicated study time. Algorithms help speed the entire process up, so brands can gain insights and leverage them fast.
What can you use a heatmap for?
Brands can use a heatmap for anything with a design element. That includes advertising, package design, in-store shelves and signage, as well as digital and other graphic assets. From the copy to the colors to the placement of your design IRL, heatmapping helps marketers and creatives understand what works and what doesn’t.
With a heatmap you can:
- Discover which design elements are seen and unseen
- Determine differentiators and driving elements in your campaigns
- Develop breakthrough communication visuals
- Learn how you stand out versus your competition on the shelf
- Evaluate what people are paying attention to on your website
Essentially, heatmapping helps brands develop creative that breaks through the clutter and products that stand out to consumers.Heatmapping as part of the consumer feedback loopYou can use heatmapping across three areas of the all-important consumer feedback loop.Heatmapping Use Cases
- UX Testing: Evaluate website layouts or digital assets for intuitive navigation and engagement.
- Innovation pipeline stage: heatmapping can help you design effective packaging for your products
- Ad & campaign development: Ensure a clear visual hierarchy that lands your brand’s message effectively.
- Shelf Testing: Optimize planograms and ensure your product stands out among competitors.
- Retailer Sell-In: Bolster retailer presentations with data-backed predictions of in-store impact.
How to run a heatmap study
Since heatmapping involves images and designs, you’ll need to have high-quality images to run a heatmapping study. Within each study, you can test up to 10 designs/images.
At Suzy, Heatmapping is currently offered as a Managed Services project through our Center of Excellence (COE) team. The COE team has years of experience conducting impactful eye tracking studies. During a study, your research analyst will run your images through our tool. The team will then gather data on strength of gaze and gaze sequence, or the order in which a consumer looks at various elements of your design.
Heatmapping works well in conjunction with other research methodologies, like monadic testing. In this multi-step process, you can learn how each unique design performs in terms of messaging and your KPIs. A heatmap will help you see which areas on the image are breaking through (and which aren’t). For example, let’s say one of your key claims is not resonating with consumers in your monadic research. By running a heatmap study, you may discover that that particular element isn’t even noticeable to consumers when they see your design. From there, you can redesign and retest until your key messaging breaks through.
Heatmapping metrics
When you run a heatmapping study, there are a few metrics to be aware of, especially Probability of Perception, Share of Attention (SOA), and Gaze Path.
Probability of Perception (POP) -POP measures the percentage of viewers drawn to a certain design element or hotspot at first glance. Our brains can process up to five distinct objects at any given time. That means there may be multiple design elements that are red-hot with attention saliency. POP will help you determine if your target consumer is seeing what you want them to see when they first lay eyes on your design.
Share of Attention (SOA) -In contrast, the SOA metric estimates the total amount of attention a given hotspot is given across the entire design element. This metric helps you compare the relative performance of multiple elements within your design or shelf placement.
Gaze Path -The gaze path metric shows the most probable path your audiences’ eyes take when they look at a design. This metric uses scientifically validated gaze sequences to measure where and in what order a consumer looks. From there, the heatmap will identify hotspots in your design, and order them based on the SOA scores and location within the design. A gaze path report numbers the hotspots in the order it’s most likely to be seen. With this information, you can determine if you have too many distracting visual elements. It can also help you determine if your intended visual hierarchy is being seen as intended.
Break through the clutter with a heatmap
Heatmapping is an effective way for brands to understand how consumers will react to and engage with creative and design elements. With a heatmap, you can:
- Get instant results. Skip the live eye-tracking study to speed up your consumer feedback loop and iterate faster.
- Eliminate the bias that comes from deliberation and overthinking (and overdesigning). Focus on the subconscious, intrinsic response your consumers have when they see a design for the first time.
- Make data-informed decisions. It’s not enough to have a design that your executive team likes. Using heatmaps helps you create designs informed by authentic and real human behavior.
Heatmapping at Suzy
Traditional heatmapping requires significant investment in consumer recruitment and specialized equipment. Suzy’s AI-powered heatmapping bypasses these limitations, offering results at a fraction of the cost and time while maintaining accuracy. Suzy’s heatmapping is powered by a predictive algorithm based on advanced neuroscience and over 1 million eye-tracking studies. It forecasts attention patterns within the first 1-2 seconds of stimulus exposure before human biases kick in. With Suzy, brands are able to take advantage of all the benefits of heatmapping, driving efficiencies in timelines and cost, while never sacrificing the quality of insights:
- No Consumer Recruitment Needed: Insights are based on advanced algorithms, eliminating the need for extensive consumer panels.
- Equipment-Free: No eye-tracking hardware required, reducing costs and logistical hurdles.
- Integrated Reporting: Suzy’s Center of Excellence provides detailed reports with actionable recommendations, blending heatmapping data with quantitative and qualitative insights.
Ready to see what your audience notices first? Discover Suzy’s AI-powered heatmapping solution and turn split-second attention into measurable results today. Contact our team.