


.png)
.png)


.png)
.png)

.png)


.png)

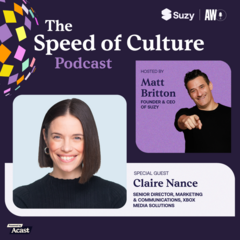
Beyond the Console: Xbox Maps the Gaming Ad Ecosystem
In this episode of The Speed of Culture podcast, Matt Britton welcomes Claire Nance, the Senior Director of Marketing Communications at Microsoft's Xbox Media Solutions, to discuss how Xbox Media Solutions is redefining the relationship between brands and the 3.6 billion people who make up the global gaming community.


Things Reading the Room: How TransUnion turns disconnected data into real signals
Marketers often find themselves caught between the promise of high-tech innovation and the reality of fragmented consumer data. Matt Spiegel, EVP of TruAudience Growth Strategy at TransUnion, joins Matt Britton on The Speed of Culture podcast to discuss how established analytical frameworks are finding new life in the era of artificial intelligence and privacy changes.

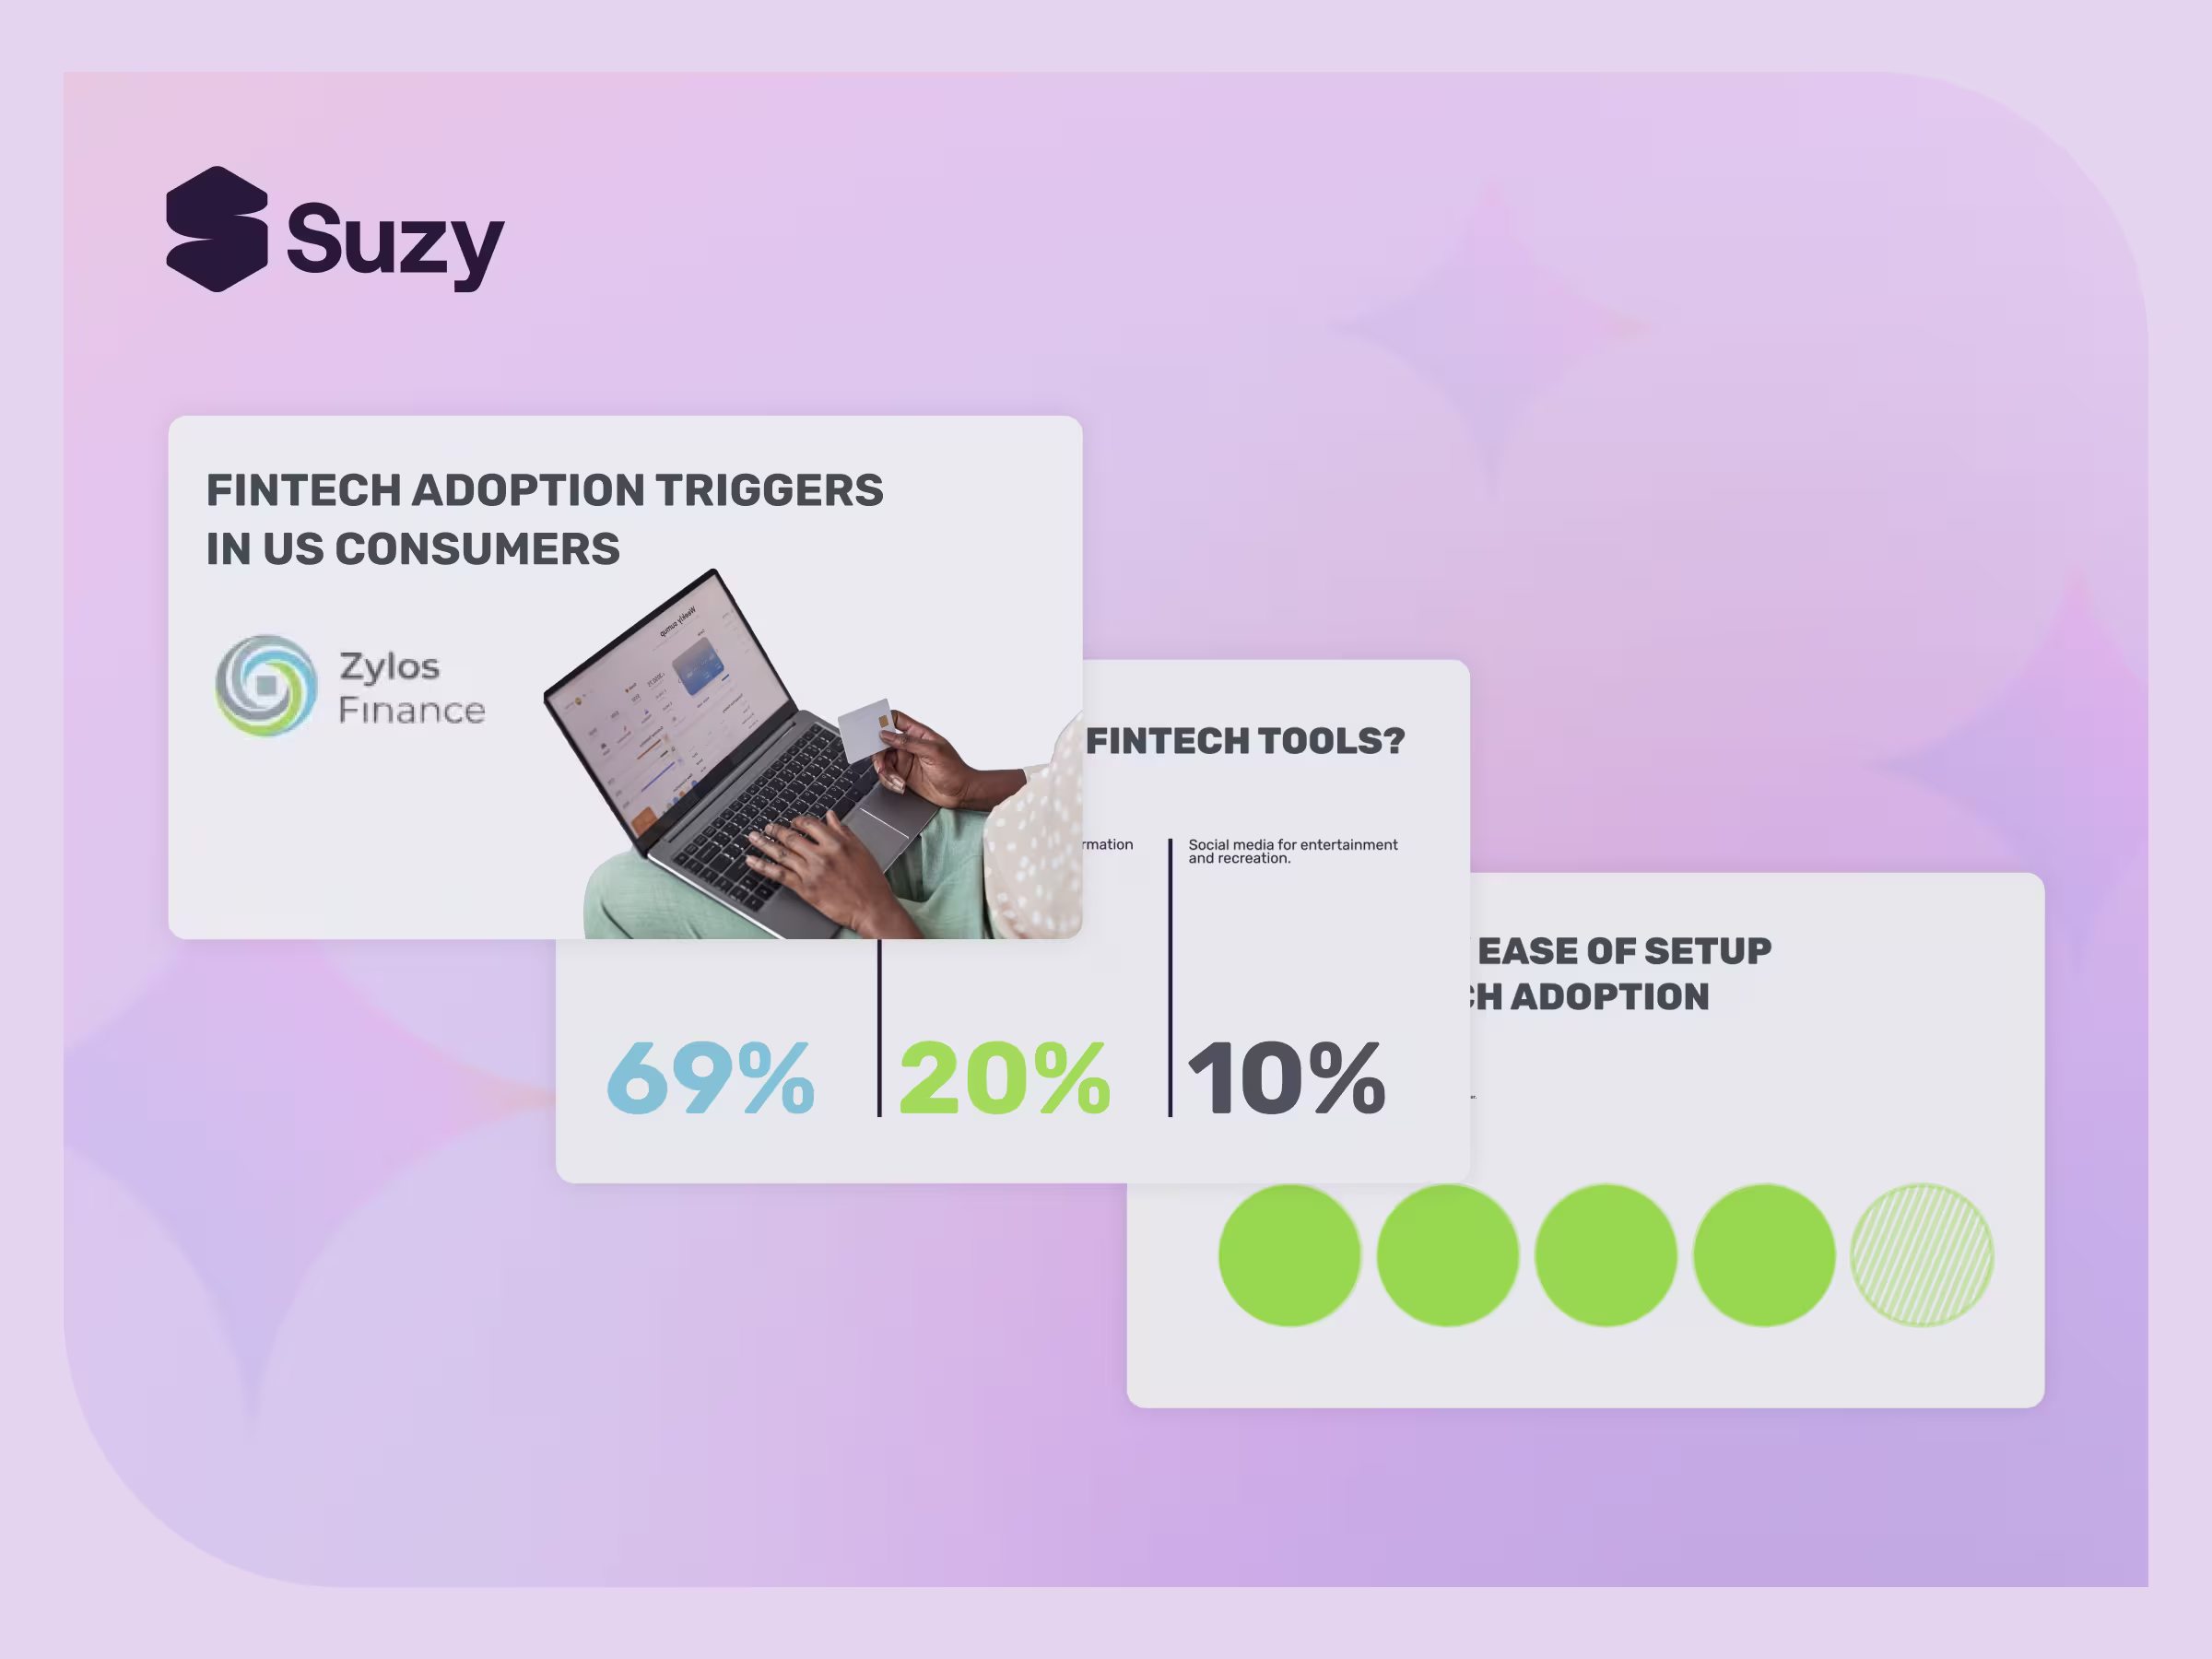
Wake up call: Financial Brands That Skip Trust Tracking Will Lose H2 2026
Financial brands that skip trust and perception tracking are making million-dollar decisions on instinct, and it's becoming increasingly expensive.
Fully Loaded: The brand strategy behind Crocs' cultural takeover
Terence Reilly, Chief Brand Officer at Crocs, Inc., joins the Speed of Culture podcast to discuss the mechanics of building brands that define their categories.
Fast Pitch: What the Women's College World Series Teaches Us About Consumer Speed
The explosive growth of Women's softball viewership shows that consumer trends move faster than traditional research cycles, and brands need real-time validation tools like Suzy to replace guesswork with data-backed marketing decisions.

Bright Side: Supergoop!'s Playbook for Turning Sun Care Into a Cultural Movement
Live from the POSSIBLE Conference in South Beach, Matt Britton welcomes Lauren Weinberg, Chief Marketing Officer at Supergoop!, to discuss her transition from tech giants like Square and Peloton to the beauty world.

Treatonomics: The Internal Permission Economy of Self-Treating
Self-treating has quietly become a daily "permission economy" — where affordability, guilt, and internal justification (not celebration) decide whether a customer says yes to a purchase, and the brands that win are the ones that make that yes feel earned rather than indulgent.
.jpg)
How Brands Can Win the Taylor Swift Wedding Moment (And Every Cultural Moment After)
The Taylor Swift wedding is this weekend. Learn how brands can capitalize on cultural moments with consumer insights and AEO strategy. Learn more with Suzy.
Beyond the Stage: How the BET Awards Became a Blueprint for Cultural Brand Building
In this episode of The Speed of Culture podcast, Louis Carr, President of BET and founder of Waymaker Media, joins Matt Britton to discuss how one of the most influential media brands in the world is evolving for a new era.